Redesigning how repair work is assigned, tracked and reported on a facilities-maintenance platform

Achareh Sazeh is a maintenance-management platform where organizations report, assign and track two kinds of work: repairs for reported failures, and preventive maintenance that repeats on a schedule. The brief was to improve its design. Research showed that the interface was only part of the problem: each role struggled to do its job in the system. I designed the changes for two client organizations.

REQUEST · R-0412 Waiting for parts

Server room AC is not cooling

Building B · Basement · Split unit 03

  1. Employee reported it09:12
  2. Technician claimed it09:40
  3. Waiting for a compressor part11:05
  4. Director sees it in the monthly reportauto
One request, four roles · sample data
Role
Senior Product Designer
Sole designer: research, information architecture, flows, UI and prototype tests in Figma
Support
UX Writer (in-product copy)
Design team weekly review, with input from the Design Lead
Clients
Hamrah-e Aval, Sharif University
Status
Shipped, in active use
  • ~75%↓

    Month-end complaints

    About 20 → 5, product manager’s estimate

  • 3 → 0

    People compiling reports

    Once all reports were in the platform

  • 2

    Client organizations live

    Hamrah-e Aval, Sharif University

Research

How the old platform worked

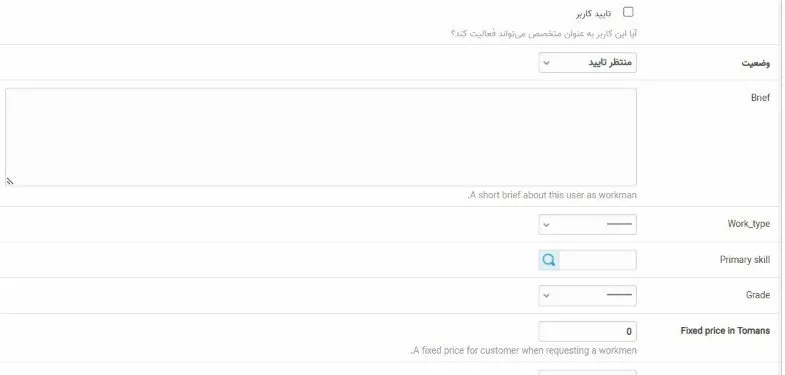
Every screen was a long admin form with all fields at the same weight. Request forms stacked many fields, some not needed, with the data scattered across them.

The question

How can each role do its own work and reach the data it needs without depending on other people, so that scattered data stops causing confusion and human error?

Old technician profile form with test data
BEFOREOld technician profile form (test data). Labels mix English and Persian, and an open text field sits among the fields.

What we heard

  • “I did not know there was an app, so I called a representative.”

    Employee

  • “I cannot see where the request stands.”

    Facility manager

  • “A 3-day repair counts the same as a 30-minute one.”

    Technician

  • “Some requests need to repeat on a schedule, and sometimes I forget to create them on time. Then the equipment gets worse.”

    Facility manager

  • “I have no repair history, so I cannot decide whether to repair or replace aging equipment.”

    Facilities director

  • “Requests come by phone or as free text, so I never know the exact location or the issue.”

    Facility manager

  • “A late request can look like my delay, even when I was waiting for parts.”

    Technician

  • “I ask Achareh for a report and wait while staff compile it by hand.”

    Facilities director

Method: no formal research budget or timeline. Informal interviews with managers and Achareh’s representatives, observation of how managers worked, and analysis of real spreadsheets, request logs and client PRDs.

Who I was designing for

Four people, four levels of evidence.

Four roles use the platform: employees who report issues, facility managers, technicians and facilities directors. I tagged each persona below by how directly I gathered it: some from interviews, one from inference alone.

Employee illustration

Employee

Reports facility issues

Weakest evidence

“I want to report issues easily and be sure they get fixed.”

Staff at the client organization, not trained in facilities work. Reporting through the platform was not the organization’s main priority.

Frustrations

  • Often did not know the system existed.
  • Reports by phone, so requests are not recorded and can be forgotten.
  • Could not see the status of a request.

How built: Not interviewed or observed. Built from the pattern of direct calls to the representative, noted in the client PRD. This is a gap.

Facility manager illustration

Facility Manager

Assigns and supervises technicians

Direct evidence

“I want to know every failure gets fixed on time, without chasing spreadsheets and phone calls.”

Manages a technician team and answers to the facilities director. Kept using Excel because the app’s data was scattered.

Frustrations

  • Assigned jobs without seeing technician location or workload.
  • Could not see where a request was stuck.
  • Had no fair way to reward technicians.
  • Had to remember when to create recurring preventive requests, such as the next engine room inspection.

How built: Informal interviews with managers.

Technician illustration

Technician

Carries out repair jobs

Indirect evidence

“I want to accept jobs without being challenged and be paid fairly for them.”

Works in client buildings, including basements and engine rooms. Not interviewed directly; known through managers and Achareh’s representatives.

Frustrations

  • Blamed by default for delays, with no record of where a request stopped.
  • Paid by job count, not difficulty.
  • Could not log completion without signal.

How built: Reported by managers and Achareh’s representatives, not by technicians.

Facilities director illustration

Facilities Director

Oversees multiple sites and teams

Indirect evidence

“I want a clear answer on equipment health and team performance without waiting for people to compile it by hand.”

Sits above the facility manager. Uses the platform only for reports.

Frustrations

  • Needed reports the old system could not produce.
  • Waited while Achareh staff compiled them by hand.
  • Could not tell which aging equipment to replace, because there was no repair history.
  • Equipment that was not serviced on time could suddenly cost a lot to fix.

How built: Not interviewed. Built from recurring report requests in the client PRD.

Journey map, all personas

One repair request, four roles.

The map follows one repair request through eight stages in four phases. Pick a role to see which stages it was involved in, what it did there, how it felt, and where the process broke down.

Request
Assign & prep
Execute & verify
Report & decide
Issue occurs
Request submitted
Job assigned
Technician en route
Work in progress
Completion logged
Performance reviewed
Equipment decision
Request

1. Issue occurs

Notices a facility issue.

Request

2. Request submitted

Does not know the app exists, so calls a representative.

Execute & verify

3. Work in progress

Cannot see the request status, so calls again to check.

Neutral
Unaffected
Dissatisfied
No pain at this stage
Not solved
Onboarding, still unsolved (see Reflection)
→ Decision 02
Request history
02 · Journey map · Pain points and opportunities2 / 2
PAIN POINTS AND OPPORTUNITIES · EMPLOYEE
PainDesign opportunity
No one can see the status of a request while it is being repaired, so managers and employees have to ask.
Facility ManagerEmployee
A request history visible to employees, managers and technicians.
Employees often did not know the system existed.
Employee
An onboarding prompt that tells staff the system exists.

Research findings

Eight findings, six decisions.

Each finding lists the source it came from. Each column is one design decision, told in Stage 05; a dot means that decision answers the finding.

Finding · source D01Push to pull D02Request history D03Linked reports D04Preventive requests D05Wi-Fi stopgap D06Photo comparison
01 · Managers assigned jobs without seeing workload
Observation of manager workflow
02 · Reports were compiled by hand
Report files, interviews with Achareh staff
03 · Causes of delay were not recorded
Manager interviews
04 · Technicians could not log completion without signal
Managers and Achareh's representatives
05 · Pay and recognition followed job count
Manager interviews
06 · Repair-vs-replace had no repair history behind it
Report requests in the client PRD
07 · Preventive maintenance depended on managers remembering
Interviews, observation, client complaints
08 · Duplicate completion photos could not be detected
Manager interviews

Core challenge

One shared cause

“Repair requests moved through a disconnected process, so each role depended on other people for the information it needed to do its work.”

The same gap appeared in observation, interviews, report files, client complaints and the client PRD. Six decisions follow, because several findings shared one cause.

What five maintenance tools show.

I compared the findings with MaintainX, Limble, UpKeep, Fiix and FMX, using each vendor's public documentation. I did not test the tools hands-on.

Finding 01 · Blind assignment

Workload when assigning

MaintainX compares workload against capacity. Limble marks overbooked days. Fiix shows team workload in one calendar. None of the pages I read show managers technician location.

MaintainX · Limble · Fiix

Finding 02 · Manual reports

Scheduled reports

Fiix sends reports to an inbox on a schedule, Limble automates reports, and MaintainX lists standard reports such as Time to Complete and On Time vs. Overdue.

Fiix · Limble · MaintainX

Finding 03 · Delay causes

Time in each status

MaintainX reports time spent in Open, In Progress and On Hold, and can require a comment for On Hold. Fiix splits downtime into waiting for a technician, for parts and repair time.

MaintainX · Fiix

Finding 04 · No-signal logging

Offline updates

Four of the five describe mobile use without a signal. UpKeep logs time, photos and close-out offline. MaintainX needs its cache prepared online first.

MaintainX · UpKeep · Limble · Fiix

Finding 06 · Repair history

History and cost per asset

Fiix's asset log shows all maintenance costs per machine. Limble lists repair cost history and failure frequency as the data for a repair-or-replace judgment.

Fiix · Limble

Finding 07 · Preventive upkeep

Preventive work orders

Limble and UpKeep create work orders from schedules. Fiix schedules by date, meter reading or event. FMX has a central calendar with reminders.

Limble · UpKeep · Fiix · FMX

Not found in the pages I read: technicians claiming jobs from a shared queue, weighting jobs by difficulty, or comparing completion photos across submissions. Absence from the documentation does not prove the tools lack these.

Tools selected using rankings from Reliamag, Capterra and Software Advice.

Six decisions

What I changed, and why.

Six decisions answer the eight findings. Each one names the findings it addresses and shows the shipped design.

Decision 01 · Addresses findings 01 · 05

From push to pull: technicians claim their jobs

Technicians now choose their jobs, so they can predict their pay.

Before · push

The manager assigned every job without seeing anyone's workload.

ManagerTechnician A · B · C

Pay followed request count, so a hard job paid the same as an easy one.

After · pull

Like drivers in a ride-hailing app (Snapp), technicians see each job's weight before claiming it.

Shared queueTechnician claims by data

Pay follows total weight completed, so technicians can predict it.

Decision 01 · How it works
01

Technicians choose from a list by location and capacity.

02

Each request has a weight based on service type and equipment group, reviewed with facilities specialists and calculated automatically.

03

Unclaimed requests turn red on the manager dashboard after a time each organization sets. The manager assigns them, seeing each technician's open jobs, skills and buildings.

Decision 02 · Addresses finding 03

Request history: recording why a request is waiting

Every change to a request is logged with its action, date, performer and notes. This includes waits, such as waiting for approval or for goods supply.

Who it helps
  • Technicians are no longer blamed by default for a wait they did not cause.
  • Managers and directors see where a request stands without calling anyone.
Decision 03 · Addresses findings 02 · 06

Reports built from linked data

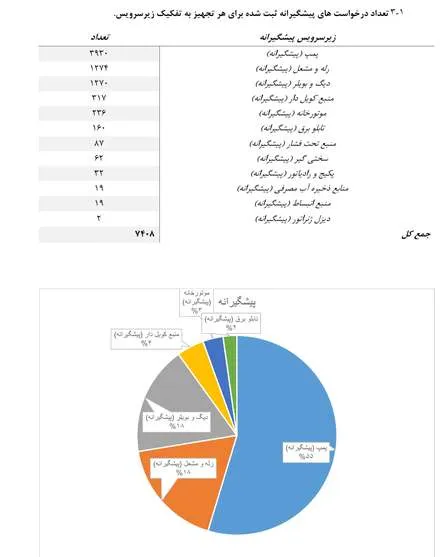
Reports were slow and wrong because requests were not connected to anything. Linking each request made the reports possible.

01 · The problem

Reports were compiled by hand

  • Staff pulled data from the database for each organization.
  • Human errors, and late delivery that made clients unhappy.
  • Requests came as free text or by phone, linked to nothing.
A page from Achareh's old monthly report: a table and a pie chart
02 · The change

Every request is linked

Requests are created by choosing from lists, not typed.

Request
03 · The result

The platform builds the reports

Technicians

Performance, speed and job difficulty, for reviews.

Equipment

Repairs and failures over time, for repair-vs-replace.

Buildings

Requests per building, to place technicians.

3 → 0people compiling reports by hand
Decision 03 · What changed after testing
First version

Mirrored Achareh's existing reports: tables with a few charts. Stakeholders said managers had repeatedly asked for charts, and that visuals affect sales, since the dashboard is demoed to clients.

Shipped

Every table has a chart (managers choose the type) and a short summary above it, such as the best technician by performance, speed and job difficulty. Managers get the answer without filtering the table.

Not every report was built at launch, so one person stayed to give organizations the data they asked for. Once the report pages were live, no one was needed.

Decision 04 · Addresses finding 07

Preventive maintenance: requests created by the system

Because buildings, equipment and requests are now linked (Decision 03), a manager can schedule a preventive request for a specific location or piece of equipment, for example cleaning a server room every 15 days.

The manager sets the repeat interval, and the system creates each request when it is due. No one has to remember to create it, or to note when the task was last done.

What we don't know yet

We expect regular scheduled checks to mean fewer breakdowns and lower repair costs over time. We have no earlier failure data to compare against, so testing it means tracking failures and repair requests per piece of equipment from now on. With two client organizations and results that take months, this will show a trend, not a firm number.

Decision 05 · Addresses finding 04

Logging without signal: Wi-Fi as a stopgap

Technicians could not log completion in basements and engine rooms with no signal. A complex technical fix would have taken time, so I mapped seven options by effort and impact. We asked the client organizations to provide Wi-Fi on their basement floors for now, which bought time to build the fix properly. Both clients agreed, and with only two clients we could ask them directly.

Not scalable

This is a stopgap. It was practical because we had only two clients and could ask them directly. With more clients, offline support (option 03) is still the real fix.

QUICK WINSMAJOR BETSFILL-INSTIME SINKS Effort required →Impact → 01 02 03 04 05 06 07
Green: the option we chose.
  • 01Ask clients for Wi-FiEach client provides Wi-Fi on its basement floors. Effort low · impact high.
  • 02Late-log reason codeA “no signal” reason, so a delayed log does not count against the technician.
  • 03Offline-first appLogs with no signal, then syncs once reconnected. Effort high · impact high.
  • 04Reconnect reminderA push notification the moment the phone regains signal.
  • 05NFC/Bluetooth tagsTap a tag at the equipment to log locally; still needs a sync step.
  • 06SMS fallbackConfirm completion by text message, with no data connection.
  • 07Paper log (temporary)A manual paper log until a real fix ships.
Decision 06 · Addresses finding 08

Comparing completion photos in one place

Managers reviewed each completion photo on its own, with no way to compare it against earlier ones, so a reused photo could pass as new work.

Each technician's detail page now has a tab with all the photos that technician has submitted, so a manager can check a new photo against earlier ones.

The comparison is done by the manager; the platform does not detect duplicates itself.

Outcome

Shipped, and in active use.

~75%↓

Month-end complaints, first month after launch (PM estimate)

3 → 0

Reporting headcount, once all report pages were live

2

Client organizations live: Hamrah-e Aval, Sharif University

Reflection

What I'd do differently.

01

Define a baseline metric from day one.

The 20 → 5 figures are the PM's approximate numbers, because complaints were never logged. Even a two-week manual count before launch would have given a measured before/after.

02

Push earlier for recorded technician interviews.

Instead of relying entirely on indirect access through the manager and PM. The constraint was real, but a recorded call would still have been possible.

03

Talk directly to the facilities director.

That persona, like the technician and employee, is built entirely from indirect signals.

Still unsolved

Employees who don't know the reporting system exists at all. That gap surfaced in research but never made it into a shipped decision. It needs an onboarding flow the client organization actually rolls out, which was outside what I could ship alone.

Redesigning how repair work is assigned, tracked and reported on a facilities-maintenance platform

Achareh Sazeh is a maintenance-management platform where organizations report, assign and track two kinds of work: repairs for reported failures, and preventive maintenance that repeats on a schedule. The brief was to improve its design. Research showed that the interface was only part of the problem: each role struggled to do its job in the system. I designed the changes for two client organizations.

REQUEST · R-0412 Waiting for parts

Server room AC is not cooling

Building B · Basement · Split unit 03

  1. Employee reported it09:12
  2. Technician claimed it09:40
  3. Waiting for a compressor part11:05
  4. Director sees it in the monthly reportauto
One request, four roles · sample data
Role
Senior Product Designer
Sole designer
Support
UX Writer
Weekly design review
Clients
Hamrah-e Aval, Sharif University
Status
Shipped, in use
~75%↓Month-end complaints
About 20 → 5, PM's estimate
3→0People compiling reports
Once all reports were in the platform
2Client organizations live
Hamrah-e Aval, Sharif University

Research

How the old platform worked

Every screen was a long admin form with all fields at the same weight. Request forms stacked many fields, some not needed, with the data scattered across them.

Old technician profile form with test data
BEFOREOld technician profile form (test data). Labels mix English and Persian, and an open text field sits among the fields.
What we heard
“I did not know there was an app, so I called a representative.”
Employee · paraphrased
“I cannot see where the request stands.”
Facility manager · paraphrased
“A 3-day repair counts the same as a 30-minute one.”
Technician · paraphrased
“Some requests need to repeat on a schedule, and sometimes I forget to create them on time. Then the equipment gets worse.”
Facility manager · paraphrased
“I have no repair history, so I cannot decide whether to repair or replace aging equipment.”
Facilities director · paraphrased
“Requests come by phone or as free text, so I never know the exact location or the issue.”
Facility manager · paraphrased
“A late request can look like my delay, even when I was waiting for parts.”
Technician · paraphrased
“I ask Achareh for a report and wait while staff compile it by hand.”
Facilities director · paraphrased

Method: no formal research budget or timeline. Informal interviews with managers and Achareh's representatives, observation of how managers worked, and analysis of real spreadsheets, request logs and client PRDs.

Who I was designing for

Four people, four levels of evidence.

Four roles use the platform. I tagged each persona by how directly I gathered it: some from interviews, one from inference alone.

Facility Manager illustration

Facility Manager

Assigns and supervises technicians

Direct evidence

“I want to know every failure gets fixed on time, without chasing spreadsheets and phone calls.”

Manages a technician team and answers to the facilities director. Kept using Excel because the app’s data was scattered.

Frustrations
  • Assigned jobs without seeing technician location or workload.
  • Could not see where a request was stuck.
  • Had no fair way to reward technicians.
  • Had to remember when to create recurring preventive requests, such as the next engine room inspection.

How built: Informal interviews with managers.

Journey map

One repair request, four roles.

Pick a role to see which stages it was involved in, what it did there, how it felt, and where the process broke down.

Emotion across stages3 of 8 stages
REQUESTASSIGNEXECUTEREPORT
  1. Request
    1. Issue occurs
    Neutral

    Notices a facility issue.

    No pain at this stage
  2. Request
    2. Request submitted
    Unaffected

    Does not know the app exists, so calls a representative.

    Not solved
    Onboarding, still unsolved (see Reflection)
  3. Execute & verify
    3. Work in progress
    Dissatisfied

    Cannot see the request status, so calls again to check.

    → Decision 02
    Request history
Pain points and opportunities · EMPLOYEE

No one can see the status of a request while it is being repaired, so managers and employees have to ask.

Facility ManagerEmployee
Design opportunity

A request history visible to employees, managers and technicians.

Employees often did not know the system existed.

Employee
Design opportunity

An onboarding prompt that tells staff the system exists.

Research findings

Eight findings, six decisions.

Each finding lists its source and the decision that answers it, told in Stage 05.

Finding 01
Managers assigned jobs without seeing workload
Observation of manager workflow
→ D01 Push to pull
Finding 02
Reports were compiled by hand
Report files, interviews with Achareh staff
→ D03 Linked reports
Finding 03
Causes of delay were not recorded
Manager interviews
→ D02 Request history
Finding 04
Technicians could not log completion without signal
Managers and Achareh's representatives
→ D05 Wi-Fi stopgap
Finding 05
Pay and recognition followed job count
Manager interviews
→ D01 Push to pull
Finding 06
Repair-vs-replace had no repair history behind it
Report requests in the client PRD
→ D03 Linked reports
Finding 07
Preventive maintenance depended on managers remembering
Interviews, observation, client complaints
→ D04 Preventive requests
Finding 08
Duplicate completion photos could not be detected
Manager interviews
→ D06 Photo comparison

Core challenge

What five maintenance tools show.

I compared the findings with MaintainX, Limble, UpKeep, Fiix and FMX, using each vendor's public documentation. I did not test the tools hands-on.

Six comparisons
Swipe · 6
Finding 01 · Blind assignment

Workload when assigning

MaintainX compares workload against capacity. Limble marks overbooked days. Fiix shows team workload in one calendar. None of the pages I read show managers technician location.

MaintainX · Limble · Fiix

Finding 02 · Manual reports

Scheduled reports

Fiix sends reports to an inbox on a schedule, Limble automates reports, and MaintainX lists standard reports such as Time to Complete and On Time vs. Overdue.

Fiix · Limble · MaintainX

Finding 03 · Delay causes

Time in each status

MaintainX reports time spent in Open, In Progress and On Hold, and can require a comment for On Hold. Fiix splits downtime into waiting for a technician, for parts and repair time.

MaintainX · Fiix

Finding 04 · No-signal logging

Offline updates

Four of the five describe mobile use without a signal. UpKeep logs time, photos and close-out offline. MaintainX needs its cache prepared online first.

MaintainX · UpKeep · Limble · Fiix

Finding 06 · Repair history

History and cost per asset

Fiix's asset log shows all maintenance costs per machine. Limble lists repair cost history and failure frequency as the data for a repair-or-replace judgment.

Fiix · Limble

Finding 07 · Preventive upkeep

Preventive work orders

Limble and UpKeep create work orders from schedules. Fiix schedules by date, meter reading or event. FMX has a central calendar with reminders.

Limble · UpKeep · Fiix · FMX

Not found in the pages I read: technicians claiming jobs from a shared queue, weighting jobs by difficulty, or comparing completion photos across submissions. Absence from the documentation does not prove the tools lack these.

Tools selected using rankings from Reliamag, Capterra and Software Advice.

Decision 01 · Findings 01 · 05

From push to pull: technicians claim their jobs

Technicians now choose their jobs, so they can predict their pay.

After · pull

Like drivers in a ride-hailing app (Snapp), technicians see each job's weight before claiming it.

Shared queueTechnician claims by data

Pay follows total weight completed, so technicians can predict it.

How it works
  1. 01Technicians choose from a list by location and capacity.
  2. 02Each request has a weight based on service type and equipment group, reviewed with facilities specialists and calculated automatically.
  3. 03Unclaimed requests turn red on the manager dashboard after a time each organization sets. The manager assigns them, seeing each technician's open jobs, skills and buildings.
Decision 02 · Finding 03

Request history: recording why a request is waiting

Every change to a request is logged with its action, date, performer and notes. This includes waits, such as waiting for approval or for goods supply.

Who it helps
  • Technicians are no longer blamed by default for a wait they did not cause.
  • Managers and directors see where a request stands without calling anyone.
Decision 03 · Findings 02 · 06

Reports built from linked data

Reports were slow and wrong because requests were not connected to anything. Linking each request made the reports possible.

01
The problem

Reports were compiled by hand

  • Staff pulled data from the database for each organization.
  • Human errors, and late delivery that made clients unhappy.
  • Requests came as free text or by phone, linked to nothing.
A page from Achareh's old monthly report: a table and a pie chart
02
The change

Every request is linked

Requests are created by choosing from lists, not typed.

Request
BuildingALWAYS
Issue typeALWAYS
EquipmentWHEN KNOWN
TechnicianWHEN KNOWN
03
The result

The platform builds the reports

Technicians

Performance, speed and job difficulty, for reviews.

Equipment

Repairs and failures over time, for repair-vs-replace.

Buildings

Requests per building, to place technicians.

3 → 0people compiling reports by hand
What changed after testing
First version

Mirrored Achareh's existing reports: tables with a few charts. Stakeholders said managers had repeatedly asked for charts, and that visuals affect sales, since the dashboard is demoed to clients.

Shipped

Every table has a chart (managers choose the type) and a short summary above it, such as the best technician by performance, speed and job difficulty. Managers get the answer without filtering the table.

Not every report was built at launch, so one person stayed to give organizations the data they asked for. Once the report pages were live, no one was needed.

Decision 04 · Finding 07

Preventive maintenance: requests created by the system

Because buildings, equipment and requests are now linked (Decision 03), a manager can schedule a preventive request for a specific location or piece of equipment, for example cleaning a server room every 15 days.

The manager sets the repeat interval, and the system creates each request when it is due. No one has to remember to create it.

What we don't know yet

We expect regular scheduled checks to mean fewer breakdowns and lower repair costs over time. We have no earlier failure data to compare against, so testing it means tracking failures and repair requests per piece of equipment from now on. With two clients and results that take months, this will show a trend, not a firm number.

Decision 05 · Finding 04

Logging without signal: Wi-Fi as a stopgap

Technicians could not log completion in basements and engine rooms with no signal. A complex fix would have taken time, so I mapped seven options by effort and impact. We asked both clients to provide Wi-Fi on their basement floors for now, which bought time to build the fix properly.

QUICK WINSMAJOR BETSFILL-INSTIME SINKS Effort required →Impact → 01 02 03 04 05 06 07
  1. 01Ask clients for Wi-FiEach client provides Wi-Fi on its basement floors. Effort low, impact high. Chosen.
  2. 02Late-log reason codeA “no signal” reason, so a delayed log does not count against the technician.
  3. 03Offline-first appLogs with no signal, then syncs once reconnected. Effort high, impact high.
Not scalable

This is a stopgap. It worked because we had only two clients and could ask them directly. With more clients, offline support (option 03) is still the real fix.

Decision 06 · Finding 08

Comparing completion photos in one place

Managers reviewed each completion photo on its own, so a reused photo could pass as new work. Each technician's detail page now has a tab with all the photos they submitted, so a manager can check a new photo against earlier ones.

The comparison is done by the manager; the platform does not detect duplicates itself.

Outcome

Shipped, and in active use.

~75%↓Month-end complaints
First month after launch, PM estimate
3→0Reporting headcount
Once all report pages were live
2Client organizations live
Hamrah-e Aval, Sharif University

Reflection

What I'd do differently.

01

Define a baseline metric from day one.

The 20 → 5 figures are the PM's approximate numbers, because complaints were never logged. Even a two-week manual count before launch would have given a measured before/after.

02

Push earlier for recorded technician interviews.

Instead of relying entirely on indirect access through the manager and PM. The constraint was real, but a recorded call would still have been possible.

03

Talk directly to the facilities director.

That persona, like the technician and employee, is built entirely from indirect signals.